Amazon EC2 Micro Instance CPU Throttling
Amazon mention that micro EC2 instances incur CPU throttling if too much of the resource is used. What isn’t explained clearly is how that throttling is shaped/applied.
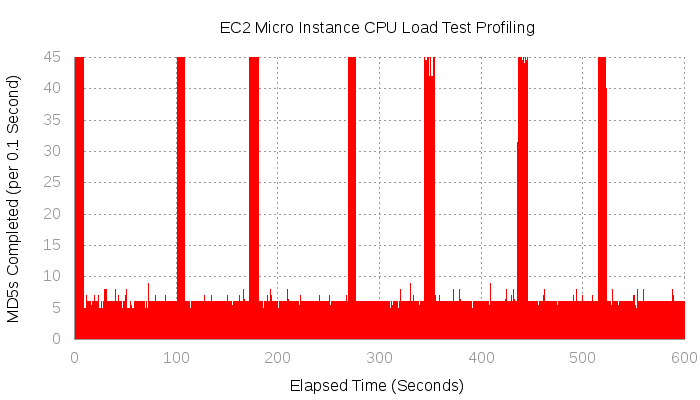
To gain a little more insight, an unscientific load test was performed. The test repeatedly performed an MD5 sum on a string (a task that should always use a similar number of CPU instructions), recording how many of those it could complete in 0.1 second. The test was performed over 10 minutes.
Micro Instance
Small Instance
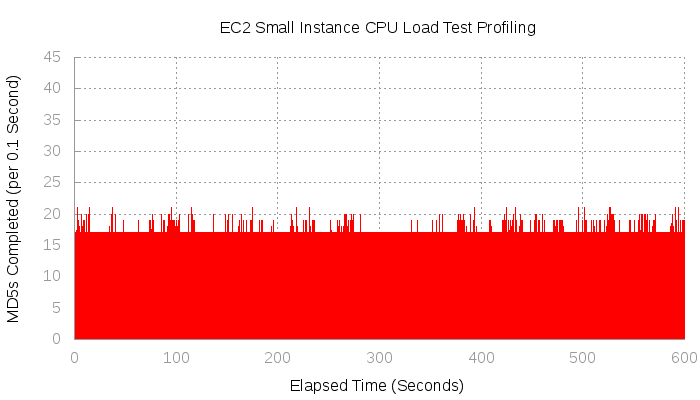
Performing the same load test on a small instance produces results that you’d expect from a non-throttled instance. The scales are the same as the micro graph for comparison:
Summary
- Micro instances can burst roughly for 8 seconds every 80 seconds.
- Micro instances allow you to burst to 3 times the consistent CPU of a small instance.
- Averaging out the bursting and throttling, a micro instance has 50% the consistent CPU of a small instance.
Raw Data and Script
Micro Instance
- Load test script output (that fed into gnuplot): micro-raw-data.txt
- Concurrent
mpstatoutput: micro-mpstat.txt - Performed 48128 MD5 sums
Small Instance
- Load test script output (that fed into gnuplot): small-raw-data.txt
- Concurrent
mpstatoutput: small-mpstat.txt - Performed 96144 MD5 sums
Load Testing Script
This is shamefully hacky, but it did the job. I had to use python, because the
/bin/date command is incredibly slow.
#!/bin/bash
FILE_PREFIX='./micro-instance'
SAMPLE_TIME=600

mpstat -u 1 $SAMPLE_TIME > $FILE_PREFIX".mpstat" &

python > $FILE_PREFIX".rawdata" << END
from time import time, sleep
import math
import hashlib

start = math.ceil(time())
current = start

sleep(start - time())

results = {}
while current < (start + ${SAMPLE_TIME}):
    index = math.floor((current - start) * 10)/float(10)
    hashlib.md5("s"*1000000).hexdigest()
    try:
        results[index] += 1
    except KeyError:
        results[index] = 1
    current = time()

for timeslot in sorted(results.iterkeys()):
    print "{0} {1}".format(timeslot, results[timeslot])
END

gnuplot <<- EOF
    set title "EC2 Micro Instance CPU Load Test Profiling"
    set xlabel "Elapsed Time (Seconds)"
    set ylabel "MD5s Completed (per 0.1 Second)"

    set terminal png size 700, 400
    set output "${FILE_PREFIX}.png"
    set key off
    set rmargin 1.5

    set style line 2 lt 0
    set style line 2 lt rgb "#999999"
    set style line 3 lt rgb "#999999"
    set grid linestyle 2
    set border 3 linestyle 3
    set xtics nomirror
    set ytics nomirror

    plot [0:${SAMPLE_TIME}] [0:45] "${FILE_PREFIX}.rawdata" with filledcurves x1
EOF